When you hear "B2B lead generation metrics," what comes to mind? We're talking about the hard numbers you use to see if your marketing is actually working. Think things like Marketing Qualified Leads (MQLs), Customer Acquisition Cost (CAC), and Lead Conversion Rates. These are the numbers that let you stop guessing and start making decisions that actually grow your revenue.
Why Most B2B Lead Generation Metrics Are Misleading
Here’s a painful truth: many B2B teams are drowning in data but starving for real insight. It's a common story. You're tracking a dozen metrics, the dashboards look great, but when you look at the sales pipeline... crickets. This is the classic trap of vanity metrics. They’re easy to measure and they feel good to report, but they don’t move the needle on what really counts: revenue. In the complex world of B2B, this problem is ten times worse.
The Unique Challenges of B2B Measurement
Selling to other businesses isn't like selling a t-shirt online. A B2C purchase can happen in minutes. A B2B deal? That's a whole different beast. The journey is way more complex, and for a few key reasons:
- Longer Sales Cycles: Decisions can drag on for months, sometimes even years. There are multiple stages of research, demos, and internal reviews before anyone signs on the dotted line.
- Multiple Decision-Makers: You're rarely selling to a single person. You’re selling to a buying committee, and each member—from the IT manager to the CFO—has their own agenda and concerns.
- Higher Stakes: B2B deals are serious investments. Your prospects need to see a crystal-clear ROI and build deep trust with you before they’ll commit.
Because of all this, a simple metric like "website traffic" or "social media likes" is basically useless. It tells you nothing about whether you're reaching the right people at your target accounts. Fixating on surface-level numbers is like trying to drive across the country by only looking at your car's odometer—sure, you know you're moving, but you have no clue if you're headed in the right direction.
Measuring B2B success demands a shift in mindset: you have to stop tracking activity and start tracking impact. The goal isn't just to generate leads; it's to generate profitable customers.
This guide will serve as your roadmap. We’re going to help you build an airtight system for measuring the B2B lead generation metrics that truly matter. We'll show you how to draw a straight line from every marketing dollar you spend to the revenue it brings in, turning your data into a reliable GPS for predictable, sustainable growth.
Building Your Metrics Foundation from MQL to SQL
Before you can build a reliable system for tracking your lead generation, you need to lay a solid foundation. That starts with getting crystal clear on the stages of your sales funnel, and the two most critical starting points are the Marketing Qualified Lead (MQL) and the Sales Qualified Lead (SQL).
Getting these definitions right is like creating a universal language for your marketing and sales teams. When everyone agrees on what a "good lead" looks like at each stage, you eliminate friction and create a smooth handoff process.
Defining the Marketing Qualified Lead (MQL)
A Marketing Qualified Lead (MQL) is a prospect who’s shown some initial interest based on how they've interacted with your marketing. They aren't quite ready for a sales call, but they've definitely moved past just being a random visitor.
Think of an MQL as someone who has gently raised their hand. They’ve signaled curiosity by taking specific actions, like:
- Downloading a whitepaper or eBook: This tells you they're actively researching a problem you can solve.
- Registering for a webinar: They're investing time to learn about your industry and solutions.
- Subscribing to your newsletter: They want to stay in the loop with your brand and insights.
- Visiting key website pages repeatedly: If someone keeps coming back to your pricing or case study pages, that’s a strong hint of deeper interest.
An MQL has hit a minimum threshold of engagement and fits your ideal customer profile (ICP), but they haven't explicitly asked to talk to a salesperson yet.
Defining the Sales Qualified Lead (SQL)
A Sales Qualified Lead (SQL) is a lead that’s been vetted and is officially ready for a direct conversation with your sales team. This is where that MQL's gentle hand raise turns into a confident, direct request for contact.
An SQL has graduated from passive research to active consideration. The sales team accepts this lead as a genuine opportunity that’s worth their immediate time and effort.
An SQL is a prospect who not only fits your ideal customer profile but has also demonstrated clear purchasing intent. This is the green light for your sales team to engage.
So what turns an MQL into an SQL? It’s usually a high-intent action like:
- Requesting a product demo.
- Asking for a price quote.
- Filling out a "Contact Sales" form.
- Directly reaching out to a sales representative.
This infographic helps visualize where these metrics fit into the bigger picture of performance tracking.
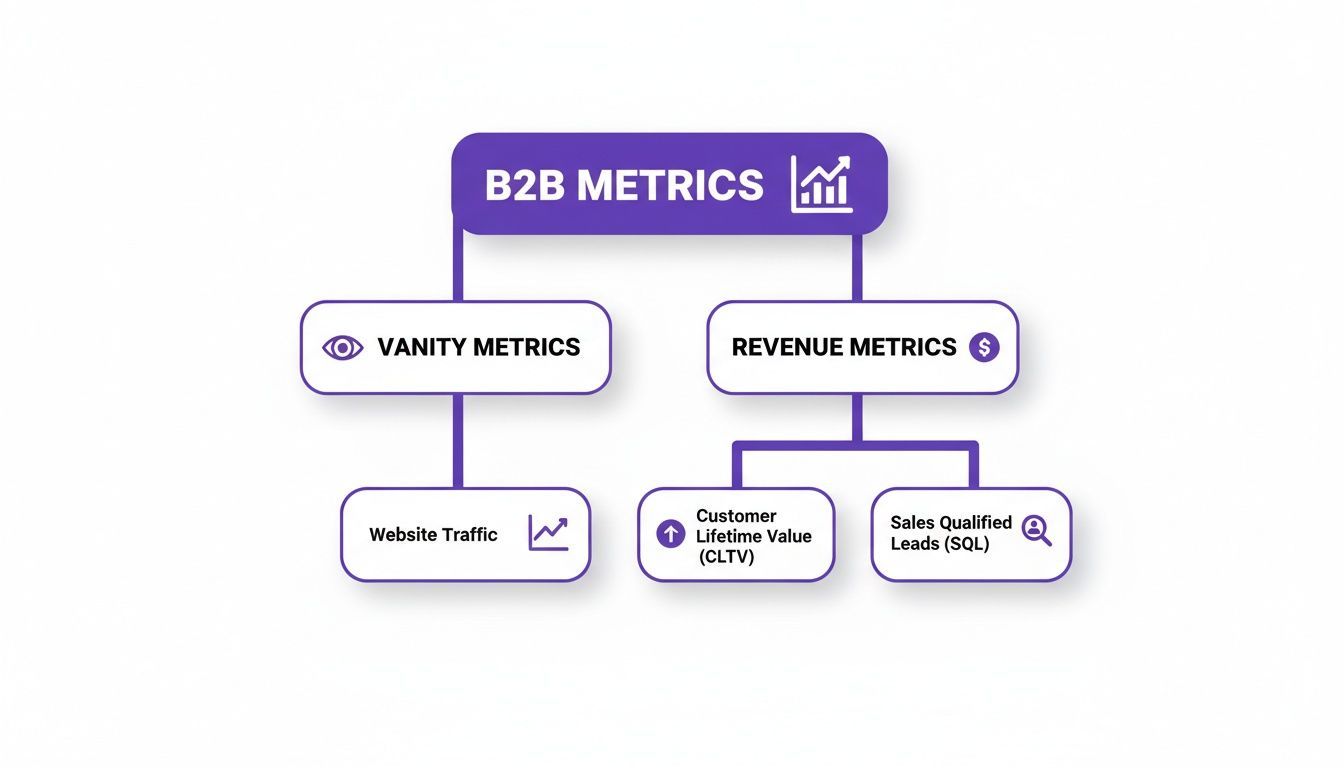
As the diagram shows, some metrics just track activity (vanity), while others directly impact the bottom line. MQLs and SQLs are the critical first step on the path to revenue. For a much deeper dive into this process, check out our complete guide on how to qualify sales leads.
Here's a sobering reality: a staggering 80% of new leads never actually result in sales. This stat highlights a massive gap between generating leads and creating revenue. By setting up clear MQL and SQL criteria, you focus your team’s energy on the leads that are most likely to convert, which dramatically improves both efficiency and your bottom line.
Calculating the Real Cost of Winning a Customer
Once you have a handle on the flow from MQL to SQL, it's time to start attaching real dollar signs to your efforts. Counting leads is one thing, but truly understanding the financial engine behind your growth is what separates the companies that scale from those that just spin their wheels. This is where the conversation shifts from activity to profitability.
Three metrics form the bedrock of this financial analysis: Cost Per Lead (CPL), Customer Acquisition Cost (CAC), and Customer Lifetime Value (LTV). Nailing down how these three work together is non-negotiable for building a business that lasts.

Unpacking Cost Per Lead and Customer Acquisition Cost
Many people use CPL and CAC interchangeably, but they measure two completely different milestones. Here’s a simple way to think about it: CPL is the cost of getting a prospect to raise their hand, while CAC is the cost of getting them to sign on the dotted line.
Cost Per Lead (CPL) is a top-of-funnel metric. It tells you exactly how much you’re spending just to get a single, new lead into your system, quality aside.
Formula: CPL = Total Marketing Spend / Total New Leads Generated
CPL is your go-to for comparing the raw efficiency of different channels. Let's say you spend $1,000 on a LinkedIn ad campaign that brings in 50 leads. Your CPL is $20. If you spend that same grand on Google Ads and only get 25 leads, your CPL is $40. Right away, you know LinkedIn is cheaper for sparking that initial interest.
But a cheap lead that goes nowhere is just a waste of money. That’s where Customer Acquisition Cost (CAC) steps in. This is the big one—it measures the total cost to land an actual, paying customer.
Formula: CAC = (Total Sales & Marketing Costs) / Number of New Customers Acquired
CAC is the whole picture. It bundles in everything from ad spend and sales commissions to the salaries for your marketing and sales teams, and even the cost of your tech stack. It gives you an honest, unvarnished look at what it truly costs to win new business.
Connecting Cost to Value with LTV
Okay, so you know what it costs to land a customer. The next question is, what are they worth to you over the long haul? That’s where Customer Lifetime Value (LTV) comes into play. It’s a projection of the total revenue you can expect from a single customer over the entire duration of their relationship with your company.
Calculating LTV can get incredibly sophisticated, but a straightforward formula to start with is:
Formula: LTV = (Average Revenue Per Account) x (Customer Lifetime)
This metric is a game-changer because it pulls your focus away from one-off sales and toward building lasting, profitable relationships. A customer who pays you $500 per month and sticks around for three years (36 months) isn't just a $500 sale—they have an LTV of $18,000.
The real magic happens when you pit LTV against CAC. The LTV:CAC ratio is arguably the most important health indicator for any B2B or subscription business. The gold standard is a ratio of 3:1 or higher. For every dollar you spend bringing a customer in, you should be getting at least three dollars back over their lifetime.
- 1:1 Ratio: Houston, we have a problem. You’re essentially losing money on every new customer once you factor in the cost of actually serving them.
- 3:1 Ratio: This is the sweet spot. You have a healthy, sustainable business model that’s ready to grow.
- 5:1 Ratio or higher: You're crushing it. It's probably time to hit the accelerator and invest more aggressively in your acquisition channels.
By getting a firm grip on CPL, CAC, and LTV, you graduate from simply counting leads. You start making strategic, data-backed decisions that drive your bottom line, ensuring every marketing dollar is an investment in profitable, long-term growth.
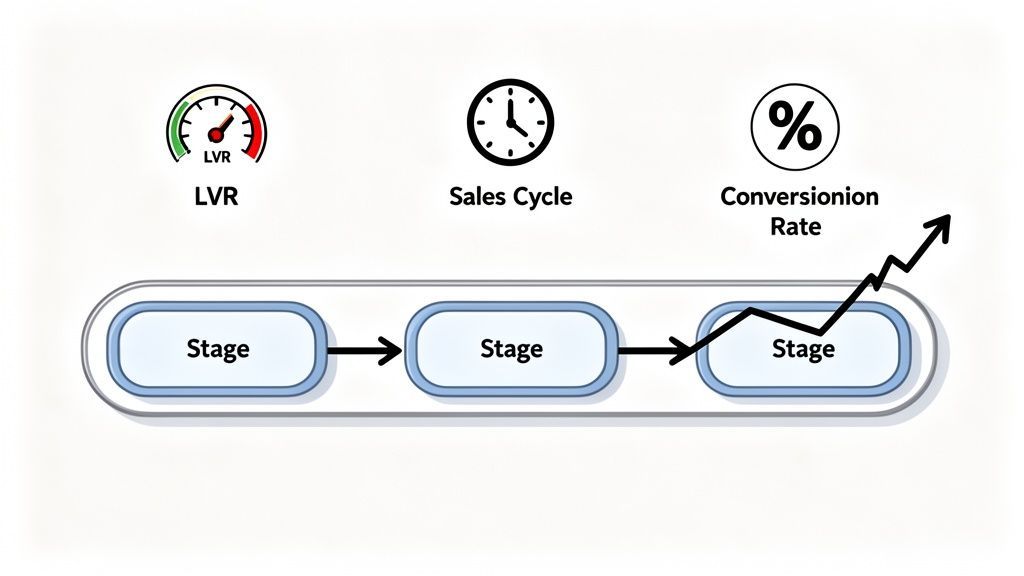
Using Advanced Metrics to Optimize Your Sales Pipeline
Once you have your foundational metrics humming along, you can shift from simply tracking costs to actively fine-tuning the speed and efficiency of your entire sales process. Think of advanced B2B lead generation metrics as a high-performance diagnostic tool for your revenue engine. They show you not just if it’s working, but how well and how fast.
Imagine your sales pipeline is a factory assembly line. Small tweaks at each stage—shaving a little time off here, improving quality control there—can have a massive impact on your final output of closed deals. These advanced metrics help you pinpoint exactly where those improvements will have the biggest bang for your buck.
Measuring Momentum With Lead Velocity Rate
While most metrics are backward-looking, Lead Velocity Rate (LVR) is a powerful leading indicator that helps you predict future revenue. It’s not about counting the number of leads you have, but measuring the growth of your qualified leads month-over-month.
This is a critical distinction. A steady number of leads can easily mask a deeper problem, making you feel secure when you're actually stalling. LVR tells you if you’re gaining or losing momentum.
Formula: LVR = [(Number of Qualified Leads This Month - Number of Qualified Leads Last Month) / Number of Qualified Leads Last Month] x 100
A healthy B2B company should always be aiming for a positive LVR; it’s a clear signal that your pipeline is expanding. If your LVR is flat or negative, it's an early warning that revenue could dip in the coming quarters, giving you precious time to act before it's too late.
Understanding Your Sales Cycle Length
Sales Cycle Length measures the average time it takes for a lead to become a customer, from that very first touchpoint to the final signed contract. In the B2B world, this can stretch on for months, making any effort to shorten this timeline a huge lever for growth.
A shorter sales cycle translates directly to:
- Faster Revenue: You close deals and get cash in the door sooner.
- Lower CAC: Your sales team spends less time and fewer resources on each deal.
- Competitive Advantage: You can simply outpace slower, more cumbersome competitors.
To really nail this, you have to ensure your entire process is built on solid ground. Adopting proven lead generation best practices is the only way to make sure your advanced metrics are driving real, sustainable growth.
Drilling Down With Channel-Specific Metrics
Not all leads are created equal. And neither are your marketing channels. Measuring your overall conversion rates is a good start, but the real, actionable insights come from breaking those numbers down by their source.
For instance, you might discover that leads from organic search have a sky-high MQL-to-SQL conversion rate, while those from paid social ads fizzle out before ever talking to sales. This level of detail requires proper attribution—the set of rules you use to assign credit for a conversion to different touchpoints in a customer's journey.
By understanding which channels contribute most effectively to your pipeline, you can confidently double down on what works and cut the dead weight.
In the tough world of B2B, this focus on quality over quantity is everything. While B2C companies might generate over seven times more leads, B2B success is all about efficiency and precision. Research consistently shows that channels like SEO often deliver the highest-scoring leads, making this kind of channel-specific analysis vital.
Automating Data Collection for Accurate Metrics
Every solid B2B lead generation metric—from CPL to LTV—is built on one thing: clean, accurate data. But the traditional way most teams get that data is a manual slog of copy-pasting names, titles, and company details from places like LinkedIn into a sprawling, messy spreadsheet.
This old-school approach isn't just slow; it’s a recipe for disaster. One typo in an email, one misplaced number, and your entire metrics framework is compromised from the start. It’s the classic "garbage in, garbage out" scenario. If your foundational data is flawed, every calculation you layer on top of it will be just as unreliable.
From Manual Tedium to One-Click Efficiency
Modern tools have completely flipped the script, turning hours of tedious labor into a single, satisfying click. Instead of painstakingly building lead lists one by one, you can now automate the entire collection process, ensuring your data is clean and consistent from the very beginning.
Think about the old way:
- You find a great source of leads—maybe a company's team page or an industry directory.
- You open a blank spreadsheet.
- You start the mind-numbing task of copying a name, then a title, then a company...
- You paste each piece of data, column by column, repeating this cycle until your eyes glaze over.
- Then comes the "cleanup" phase, where you fix formatting quirks and copy-paste errors before you can even think about uploading it to a CRM.
This workflow doesn't just kill productivity; it burns through valuable time your sales and marketing teams could be spending on work that actually moves the needle, like closing deals or refining strategy.
The ProfileSpider Workflow: A Modern Solution
This is where a no-code, AI-powered tool like ProfileSpider changes the game. It acts as a modern alternative to traditional scraping, instantly pulling structured profile data from any webpage and making sure your metrics are built on a rock-solid foundation of clean, consistent information.
Here’s how that simple one-click workflow works:
- Step 1: Find any webpage with the profiles you want to capture.
- Step 2: Open the ProfileSpider extension and just click "Extract Profiles."
- Step 3: The tool's AI immediately scans the page, identifies all the personal and company profiles, and organizes them into a neat list right inside the extension.
- Step 4: Export the clean, structured data to a CSV or Excel file with another click. It's ready to go straight into your CRM or marketing automation platform.
The ProfileSpider dashboard gives you a clean, organized view of every profile you've extracted, ready to be managed and exported.
From this interface, you can manage your lists, add notes, and export your data, ensuring no lead falls through the cracks.
By automating your data collection, you're not just saving time—you're eliminating human error at the source. This frees your team to focus on analyzing the metrics and making smart decisions instead of getting bogged down in low-value data entry.
Getting that initial data capture right is a huge first step. To see how this slots into your wider strategy, check out these 7 lead generation automation workflows that actually convert. Adopting automation is the key to ensuring your B2B lead generation metrics are not only accurate but gathered with maximum efficiency.
Avoiding Common B2B Metrics Tracking Pitfalls
Even the sharpest, most data-obsessed teams trip up when tracking B2B lead generation metrics. A tiny misalignment here or a patch of bad data there can poison your entire reporting system, leading to flawed decisions and wasted cash. If you want a measurement framework you can actually trust, you have to sidestep these common mistakes.
The goal is to build a single source of truth—one dashboard that both sales and marketing can look at to see what’s working and confidently steer the ship.
Misaligned Definitions Between Sales and Marketing
One of the most frequent—and damaging—pitfalls is when sales and marketing can’t agree on what basic terms like "MQL" and "SQL" actually mean. It happens all the time. Marketing’s definition of a qualified lead doesn't match what sales considers a real opportunity, and the whole handoff process grinds to a halt.
Marketing celebrates hitting its MQL quota, while the sales team is drowning in low-quality leads who aren't ready to talk. This creates friction and wastes everyone's time. The fix is to sit down together and create a shared "data dictionary" or a Service Level Agreement (SLA). This document needs to spell out, in no uncertain terms, the exact criteria for each stage, ensuring both teams are speaking the same language.
Prioritizing Vanity Metrics Over Revenue KPIs
It’s easy to get distracted by shiny objects—metrics that are simple to track and look great on a chart, like website traffic, social media followers, or email open rates. While these numbers aren't totally useless, they are vanity metrics. They don't have a direct line to revenue. Celebrating a huge spike in traffic is pointless if none of those visitors ever become leads or customers.
The real measure of success isn't activity; it's impact. Always prioritize metrics that clearly connect to the bottom line, like Customer Acquisition Cost (CAC), Lifetime Value (LTV), and MQL-to-SQL conversion rates.
Shifting your focus this way ensures your efforts are always aimed at profitable growth, not just making noise.
Ignoring Poor CRM Data Hygiene
Your CRM is the heart of your entire metrics system, but it's only as good as the data you feed it. Inaccurate, outdated, or duplicate contact information can completely throw off your reports. For instance, if your lead data is stale, your outreach campaigns will bomb, artificially driving up your Cost Per Lead (CPL).
This is a massive challenge for sales pros and marketers, especially when pulling leads from platforms like LinkedIn. After all, 89% of B2B marketers use LinkedIn for lead generation. But without clean data, even the best leads are dead on arrival. You can learn more about keeping your lead data fresh and make sure your metrics actually reflect reality.
Regular data hygiene isn't just a "nice-to-have"; it's non-negotiable. This means:
- Scheduled Cleanups: Set a regular time to de-duplicate contacts and clear out inactive or invalid records.
- Standardized Entry: Enforce consistent formatting for all data points. No more "CA" vs. "California."
- Automated Data Capture: Use tools like ProfileSpider to pull clean, structured profile data straight from the source. This one-click, no-code approach cuts out the human error that always creeps into manual entry and ensures your metrics are built on a solid foundation.